TRL Transformational Maps
In our Humanities unit Thin Red Lines, we learned about making maps, cartography, and the meaning that maps have behind them. For our Action Project, we were asked to make maps of our own, making sure that they were transformational maps. We also had to write rationales for all of our maps, explaining the cartographic choices we made. Below are pictures of the transformational maps that I made, as well as the rationales that I made to go with them.
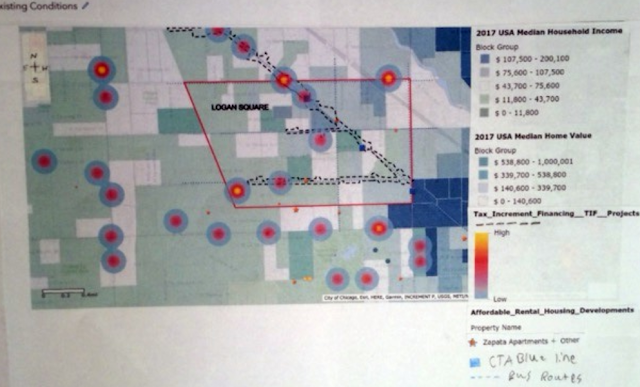
The issue that this map addresses is gentrification in Logan Square.The boundaries of my map are: Diversey Ave, Bloomingdale Ave, Western Ave, and Pulaski Rd. Gentrification occurs when a neighborhood gets redeveloped and its housing prices go up, forcing lower-income residents out and moving more higher-income residents in. I chose to use warmer colors for the TIF project areas to make them pop out. I included several different categories onto my map. Those categories were: Mobility, demographic and housing profile, community history and past plans,and land use and development.
“Gentrification means that the neighborhood changes in terms of the type of people who move into it. Some people have an opportunistic view that the neighborhood will turn and that the real estate value will increase substantially over a short period of time. So as these more affluent people move into the neighborhood, it not only increases the value of homes, but also as that area becomes more desirable to live in, the taxes increase. I own a rental property in a neighborhood that became gentrified, and I’ve seen the property taxes increase to 10 times what they were when I purchased the property...There is that feeling of stability in our neighborhood. Meanwhile, in the rental neighborhood, things are drastically different. What was once a Hispanic community is now a White/Caucasian community, because of gentrification. Rent control would be one solution to this problem. I would know that the solution had worked because rent prices would stabilize at one point either all around the city, or in each individual neighborhood.”- Steve Havens, my father, on gentrification.
Over the last 15 years, Logan Square has lost more Hispanic residents than of any of the city's 77 community areas, according to U.S. Census data released last year. Between 2000 and 2014, about 19,200 Hispanic residents moved out of Logan Square, a 35.6 percent decrease, according to the data. Over that same period, the white population in the neighborhood increased by about 10,340 residents, a 47.6 percent increase. In 2000, Hispanic residents accounted for 65 percent of the neighborhood’s 82,715 residents. By 2014, Hispanics made up 46.8 percent of the neighborhood. This is all caused by gentrification.

Overall, nearly 55 percent of renters citywide spend more than a third of their income on housing. Half of all Chicago owners are at risk of disruption in their housing stability. In Chicago, the fairly widespread observation that some neighborhoods are getting wealthier and others are getting poorer is one of the most important contexts for setting community development priorities.
Emerging Bipolarity is when both the high income population and low income population are increasing the the context is emerging bipolarity. “An example of EB is logan square. The area is extremely well served by public transportation rail lines and expressways, and has other excellent public amnities such as parkways and boulevards. Opposes redlining and slumlording, and has never gone through serious deterioration or abandonment. Has made it a place where the low income population work to ‘defend’ their ablility to stay in the neighborhood against the market entry of new generations of high income buyers and renters who find the neighborhood attractive for the same reasons.”- D. Garth Taylor, Income Diversity and the Context of Community Development.
Bipolarity is a challenging pattern for community development practisioners because the neighborhood is, technically speaking, diverse, but integration, if it is to happen, will involve shared activites, space, and urban meanings between a very low-income population and a very high-income population. In general, they are places with a great deal of contested ground. Even though it is based on 40 years of trend data, the “bipolar status” in Logan Square is still clearly a snapshot. Development strategies will include subsidized construction of rental and pruchase units at a range of price points and social/cultureal progreamming strategies for integrating high- and low-income populations into a shared use of public, commercial, and cultural space.

Logan Square reached the tipping point several years ago and the gentrification is in its second wave. Now the "early gentrifiers" are now being displaced as high-rise condos are being built. Logan Square will be like Wicker Park and Lincoln Park within the next ten years.
Planet fitness: zone b1-1. School: zone rs-3 allows one single-family per lot or one two-flat per lot. Change it to a rm-4 or possibly a pd. A pd zoning indicates a specific planned development drawn up by negotiation amongst the proposer chicago dept. of planning and development, the chicago plan commision, the alderman, and the residents. Convert the existing 4 story masonry building to 32 residential units with an attached garage. Along the Milwaukee corridor and east, 69% of housing has high income, with high home prices and rents, while to the west of the corridor, 31% of housing has high forclosure/vacany, with low/moderate income.
I used a mercator projection to show a top-down sattelite veiw. I changed my basemap, so that I could show specifically the lot I’d want to redevelop. There’s no affordable housing around where I want the afforable housing, and the plot is being underused. I’d make it rental units, not condos. Demand for walkable community, rich in amenities and transportation options. My boundaries are Kedzie Ave., the Kennedy Expressway, Logan Blvd., and Diversey Ave. I’d create financing vehicles that support mission-driven developers to acquire and maintain affordable housing units, and implement policies that create affordable housing as new market-rate housing is built.

“Gentrification means that the neighborhood changes in terms of the type of people who move into it. Some people have an opportunistic view that the neighborhood will turn and that the real estate value will increase substantially over a short period of time. So as these more affluent people move into the neighborhood, it not only increases the value of homes, but also as that area becomes more desirable to live in, the taxes increase. I own a rental property in a neighborhood that became gentrified, and I’ve seen the property taxes increase to 10 times what they were when I purchased the property...There is that feeling of stability in our neighborhood. Meanwhile, in the rental neighborhood, things are drastically different. What was once a Hispanic community is now a White/Caucasian community, because of gentrification. Rent control would be one solution to this problem. I would know that the solution had worked because rent prices would stabilize at one point either all around the city, or in each individual neighborhood.”- Steve Havens, my father, on gentrification.
Over the last 15 years, Logan Square has lost more Hispanic residents than of any of the city's 77 community areas, according to U.S. Census data released last year. Between 2000 and 2014, about 19,200 Hispanic residents moved out of Logan Square, a 35.6 percent decrease, according to the data. Over that same period, the white population in the neighborhood increased by about 10,340 residents, a 47.6 percent increase. In 2000, Hispanic residents accounted for 65 percent of the neighborhood’s 82,715 residents. By 2014, Hispanics made up 46.8 percent of the neighborhood. This is all caused by gentrification.

Overall, nearly 55 percent of renters citywide spend more than a third of their income on housing. Half of all Chicago owners are at risk of disruption in their housing stability. In Chicago, the fairly widespread observation that some neighborhoods are getting wealthier and others are getting poorer is one of the most important contexts for setting community development priorities.
Emerging Bipolarity is when both the high income population and low income population are increasing the the context is emerging bipolarity. “An example of EB is logan square. The area is extremely well served by public transportation rail lines and expressways, and has other excellent public amnities such as parkways and boulevards. Opposes redlining and slumlording, and has never gone through serious deterioration or abandonment. Has made it a place where the low income population work to ‘defend’ their ablility to stay in the neighborhood against the market entry of new generations of high income buyers and renters who find the neighborhood attractive for the same reasons.”- D. Garth Taylor, Income Diversity and the Context of Community Development.
Bipolarity is a challenging pattern for community development practisioners because the neighborhood is, technically speaking, diverse, but integration, if it is to happen, will involve shared activites, space, and urban meanings between a very low-income population and a very high-income population. In general, they are places with a great deal of contested ground. Even though it is based on 40 years of trend data, the “bipolar status” in Logan Square is still clearly a snapshot. Development strategies will include subsidized construction of rental and pruchase units at a range of price points and social/cultureal progreamming strategies for integrating high- and low-income populations into a shared use of public, commercial, and cultural space.
“Similar to cities utilizing the inside-out approach, gentrification starts within a core neighborhood and spreads outward. But instead of radiating outward more or less equally in all directions, it extends outward in one or two directions. Chicago may be the best example of this approach, with gentrification activity steadily moving from the city's near north side gentrification core to the north and northwest.”-Pete Saunders, The Four Ways Wealth Spreads in Cities. I made my map the way I did because I wanted to be able to show the community demands of Logan Square easily in map form.

Logan Square reached the tipping point several years ago and the gentrification is in its second wave. Now the "early gentrifiers" are now being displaced as high-rise condos are being built. Logan Square will be like Wicker Park and Lincoln Park within the next ten years.
Planet fitness: zone b1-1. School: zone rs-3 allows one single-family per lot or one two-flat per lot. Change it to a rm-4 or possibly a pd. A pd zoning indicates a specific planned development drawn up by negotiation amongst the proposer chicago dept. of planning and development, the chicago plan commision, the alderman, and the residents. Convert the existing 4 story masonry building to 32 residential units with an attached garage. Along the Milwaukee corridor and east, 69% of housing has high income, with high home prices and rents, while to the west of the corridor, 31% of housing has high forclosure/vacany, with low/moderate income.
I used a mercator projection to show a top-down sattelite veiw. I changed my basemap, so that I could show specifically the lot I’d want to redevelop. There’s no affordable housing around where I want the afforable housing, and the plot is being underused. I’d make it rental units, not condos. Demand for walkable community, rich in amenities and transportation options. My boundaries are Kedzie Ave., the Kennedy Expressway, Logan Blvd., and Diversey Ave. I’d create financing vehicles that support mission-driven developers to acquire and maintain affordable housing units, and implement policies that create affordable housing as new market-rate housing is built.

Comments
Post a Comment